MN-CMS Neonatal Jaundice Treatment Graph
Following the successful implementation of Phase 1 of the MN-CMS National Electronic Health Record (MN-CMS EHR) for Obstetric, Neonatal & Gynaecology patients, one vital element - the Neonatal Jaundice Treatment Graph remained on paper due the lack of a software solution. For optimal neonatal care this functional gap required a unique pathfinding digital resolution within MN-CMS.
Neonatal Jaundice is the most common condition needing medical attention in both term and preterm babies. Approximately 60% of term and 80% of preterm babies develop jaundice in the first week of life (NICE Clinical Guidelines, 2010).
The National Institute of Clinical Excellence (NICE) is the gold standard in Neonatal Jaundice Treatment thresholds and provide neonatal clinicians with a jaundice graph based a specific gestation age from 23 weeks to >38 weeks gestation. This graph was completed on paper with clinicians selecting the correct gestation age graph, transcribing patient details, time of birth, age in hours and then manually plotting the patient’s bilirubin result onto the graph using the correct X and Y axis plotting. This paper graph record was not filed/scanned into the patient’s EHR until it was completed after 14 days of life and so was separate to their EHR record.
")
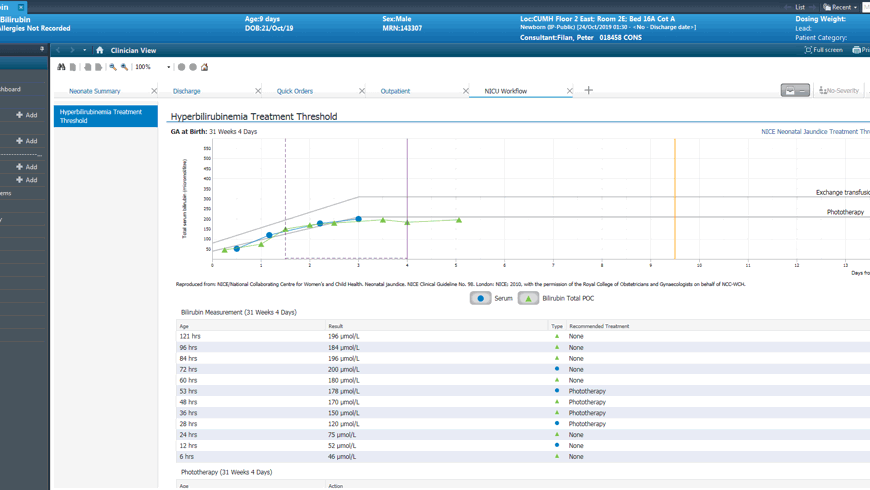
The goal of this project was to implement a digital NICE Jaundice Treatment Graph within the EHR, which would automatically select the correct predictive graph based on gestational age and plot bilirubin levels directly from a 3rd party laboratory system at the correct point in time, based on age and time of blood sampling. An added bonus within the digital graph was to display the time when phototherapy treatment was commenced and discontinued for a clear clinical picture.
The project’s initial steps began with the MN-CMS EHR vendor (Cerner) acquiring permission and rights to reproduce the graph from the Royal College of Obstetricians and Gynaecologists (RCOG) on behalf of the National Collaborating Centre for Women and Children’s Health (NCC-WCH). The project then progressed through several managed steps: Workflow & Design, Testing & Training, and Go-Live & Support.
Data indicates that users are routinely using this Graph within the EHR to decide neonatal treatment for jaundice with an average of 550 (2022) clinicians accessing the graph daily.
Unique Features:
- The graph loads accurately based on the gestational age of the baby.
- Laboratory results of Serum Bilirubin from 4 hospital laboratory systems plot directly onto the graph.
- Bilirubin blood results from Point of Care Tests are automatically displayed in the graph.
- The graph recommends ‘Phototherapy Treatment’ based on relevant blood results in compliance with the NICE guidelines.
Contact: Catherine.Jinks@hse.ie